17 Best BI Tools
BI Tools
Business intelligence (BI) tools have become indispensable assets for organizations aiming to thrive in a data-driven market. These tools are designed to transform raw data into meaningful insights, enabling businesses to make informed decisions swiftly and efficiently. BI tools encompass a range of functionalities, from data mining and analytics to reporting and dashboard creation, all tailored to enhance a company’s understanding of its operational, financial, and strategic landscapes. With the ability to analyze trends, forecast outcomes, and visualize complex datasets, BI tools empower companies to optimize processes, identify growth opportunities, and maintain a competitive edge. The integration of artificial intelligence (AI) within these tools has further elevated their capabilities, automated data analysis and offering predictive insights that were once beyond reach. As the volume of data generated by businesses continues to expand exponentially, the utilization of BI tools is not just a strategic move—it’s becoming a necessity for survival and success in today’s fast-paced business environment.
The Need for BI Tools
In an era where data is generated at an unprecedented scale, the need for BI tools is more pronounced than ever. Companies are inundated with information from various sources, including customer interactions, supply chain logistics, market trends, and internal operations. The challenge lies not in the collection of data but in its interpretation and the subsequent action derived from it. BI tools serve as the bridge between data collection and strategic action, providing a platform for data to be analyzed, visualized, and transformed into actionable intelligence. They enable businesses to sift through the noise, identify patterns, and uncover insights that drive strategic decision-making. With the aid of BI tools, organizations can react to market changes with agility, tailor their offerings to meet customer demands, and streamline their operations for maximum efficiency. The strategic deployment of BI tools can lead to enhanced customer satisfaction, improved operational efficiency, and ultimately, a robust bottom line. As businesses continue to navigate the complexities of the digital landscape, the need for comprehensive, AI-enhanced BI tools will only intensify, solidifying their role as critical components of a successful business strategy.

Best BI Tools
- Power BI
- Datapine
- Oracle Analytics Cloud
- Spotfire
- IBM Cognos Analytics
- Qlik Sense
- Yellowfin
- Amazon QuickSight
- Dundas BI
- SAP Analytics Cloud
- SAS Visual Analytics
- Zoho Analytics
- Tableau
- Domo
- Sisense
- MicroStrategy
- TIBCO
How does BI Tools work?
BI tools are designed to make sense of the huge quantities of data that organizations accumulate over time. They work by collecting data from various sources within the organization, which can include financial systems, marketing data, customer databases, and more. Once the data is collected, BI tools help to organize, store, and analyze this information, turning it into actionable insights.
The core functionality of BI tools involves data analysis, which allows businesses to understand trends, patterns, and anomalies within their data. This is achieved through various methods such as data mining, which searches for patterns within large sets of data, and predictive analytics, which uses statistical models and forecasts to predict future trends based on historical data.
Another critical aspect of how BI tools work is data visualization. These tools often come with a range of visualization options, such as graphs, charts, and heat maps, which make it easier for users to interpret the data and derive meaningful insights. Good data visualization helps in communicating complex data in a simple and effective manner, enabling stakeholders to make informed decisions quickly.
Moreover, BI tools often offer dashboard capabilities, where key performance indicators (KPIs) and critical metrics are displayed in an easy-to-read format. Dashboards can often be customized to show the most relevant data for different users or departments within an organization.
How to choose BI Tools?
Choosing the best BI tools for your organization is a critical decision that can significantly impact your ability to make data-driven decisions. When selecting a BI tool, there are several parameters and features to consider.
Firstly, consider the integration capabilities of the BI tools. It should be able to seamlessly integrate with your existing databases and software systems to ensure a smooth flow of data. The tool should support a wide range of data sources and formats, allowing you to bring together data from different parts of your business.
The ease of use is another important factor. The BI tool should have an intuitive interface that can be used by employees with varying levels of technical expertise. A user-friendly tool will ensure higher adoption rates and will enable more of your team to benefit from data analytics.
Scalability is also a key consideration. As your business grows, so will your data analysis needs. The BI tools you choose should be able to scale with your business, handling increasing volumes of data without a drop in performance.
Analytical capabilities are at the heart of any BI tool. Look for advanced analytics features such as predictive analytics, data mining, and the ability to perform ad-hoc analyses. The tool should provide deep insights and not just basic reporting functionality.
Finally, consider the level of support and training provided by the vendor. A good BI tool will be backed by strong customer support to help you resolve any issues quickly. Additionally, the vendor should offer comprehensive training to help your team make the most of the tool.
In summary, when choosing a BI tool, you need to consider integration capabilities, ease of use, scalability, analytical features, and the level of support and training. By carefully evaluating these aspects, you can select a BI tool that will serve your organization’s needs and help you leverage your data for better decision-making.
Top BI Tools
1. Power BI

Power BI is a comprehensive business intelligence tool developed by Microsoft that enables organizations to aggregate, analyze, visualize, and share data through an intuitive interface. It caters to a wide range of professional needs, from data mining and basic reporting to complex data modeling and real-time analytics. Power BI facilitates the transformation of raw data into meaningful insights, allowing businesses to make informed decisions swiftly. Its integration with other Microsoft products enhances its utility, making it a versatile tool for users already embedded in the Microsoft ecosystem. With its cloud-based service, Power BI ensures that users can access updated information anytime, anywhere, fostering a culture of data-driven decision-making within organizations.
What does Power BI do?
Power BI empowers users to connect to a vast array of data sources, both on-premises and in the cloud, to gather and process data in real-time. This BI tool provides a platform for transforming this data into actionable insights through its robust data modeling capabilities. Users can create visually appealing reports and dashboards that are easy to interpret and share across teams or with stakeholders, enhancing collaboration and strategic planning. Power BI’s ability to perform advanced analytics, including predictive modeling and AI-driven insights, allows users to forecast trends and make proactive business decisions. Additionally, its user-friendly interface and extensive customization options enable users to tailor reports and dashboards to meet specific organizational needs, making complex data analysis accessible to users with varying levels of technical expertise.
Power BI Key Features
Data Connectivity: Power BI offers unparalleled data connectivity options, allowing users to import data from a wide range of sources, including cloud-based services, databases, and spreadsheets. This feature ensures that all relevant data can be consolidated for comprehensive analysis.
Real-Time Analytics: The tool provides real-time analytics capabilities, enabling businesses to monitor their operations as they happen. This feature is crucial for making timely decisions based on the latest data.
Custom Visualizations: With Power BI, users can create custom visualizations to better represent their data. This flexibility allows for the creation of tailored reports and dashboards that resonate with the intended audience.
Data Modeling: Power BI includes powerful data modeling tools that help users organize, manage, and explore complex data relationships. This feature is essential for uncovering deeper insights and trends within the data.
Integration with Microsoft Products: Seamless integration with other Microsoft products, such as Excel and Azure, enhances the functionality of Power BI, making it a natural choice for organizations already using Microsoft solutions.
Collaboration and Sharing: Power BI facilitates easy sharing and collaboration on reports and dashboards. Users can share insights with team members or stakeholders, ensuring everyone is informed and aligned on key business metrics.
Security and Compliance: Power BI adheres to Microsoft’s stringent security protocols, offering robust data protection and compliance features. This ensures that sensitive business data remains secure while being analyzed and shared.
2. Datapine
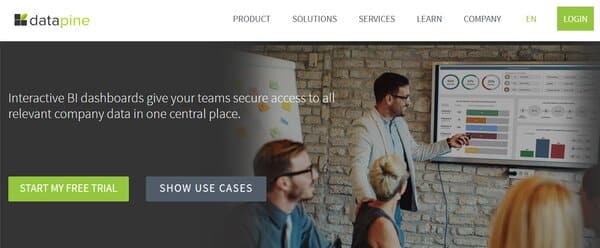
Datapine is a business intelligence platform that provides a suite of tools designed to help businesses transform raw data into actionable insights. This BI tool offers a user-friendly interface that simplifies the process of data analysis, making it accessible to users of varying technical expertise. With a focus on self-service analytics, Datapine enables users to create interactive dashboards, perform in-depth analysis, and generate automated reports, all aimed at enhancing data-driven decision-making.
What does Datapine do?
Datapine facilitates efficient data analysis and reporting by allowing users to connect to various data sources, create custom visualizations, and share insights across an organization. It empowers users to monitor key performance indicators (KPIs) and utilize artificial intelligence algorithms to detect anomalies and patterns in data. The platform is designed to cater to the needs of businesses of all sizes, providing them with the tools to analyze data, identify trends, and make informed business decisions without the need for extensive technical knowledge.
Datapine Key Features
Drag-and-Drop Interface: Datapine’s intuitive drag-and-drop interface simplifies the creation of dashboards and reports, enabling users to visualize data without the need for coding skills.
Self-Service Analytics: The platform’s self-service analytics capabilities allow users to independently explore data, create visualizations, and perform complex analyses with minimal reliance on IT departments.
Automated Reporting: Datapine offers automated reporting features that save time and ensure stakeholders receive timely, relevant data insights through scheduled report delivery.
Predictive Analytics: With predictive analytics tools, users can forecast trends and make projections based on their data, helping to inform future business strategies.
Data Connectors: A wide array of native data connectors makes it easy to integrate Datapine with various databases, flat files, and social media platforms, streamlining the data analysis process.
Customizable Dashboards: Users can tailor dashboards to their specific needs, incorporating a variety of visualization options and interactive elements to enhance data storytelling.
Mobile Accessibility: Datapine’s mobile app extends the functionality of the platform, allowing users to access their dashboards and reports on the go, although with some limitations compared to the desktop version.
Customer Support: The platform is complemented by a responsive customer service team that assists users with any issues, contributing to a positive user experience.
Advanced SQL Knowledge for Complex Features: While basic features are accessible to all users, leveraging Datapine’s more advanced capabilities requires a certain level of SQL knowledge.
Industry-Specific Templates: Despite offering a range of templates, some users may find the need for more industry-specific options to reduce the time spent on customizing dashboards.
14-Day Free Trial: Datapine provides a 14-day free trial, giving potential users a brief period to evaluate the software’s features before committing to a purchase.
3. Oracle Analytics Cloud
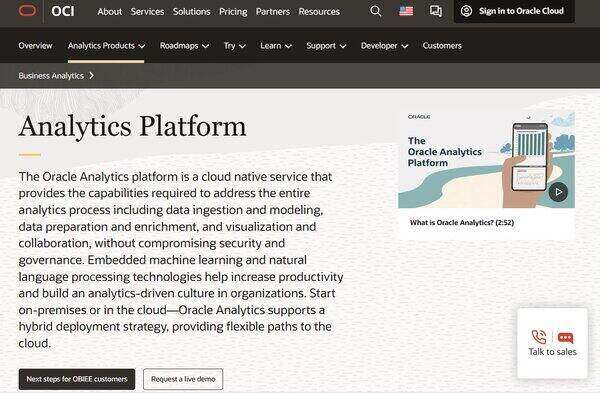
Oracle Analytics Cloud is a comprehensive cloud-native BI tool service designed to support the full spectrum of analytics activities. It facilitates data ingestion, modeling, preparation, and enrichment, as well as visualization and collaboration. The platform is engineered to ensure security and governance are not compromised while providing these services. It integrates machine learning and natural language processing to enhance productivity and foster an analytics-centric culture within organizations. Oracle Analytics Cloud is versatile, supporting both on-premises and cloud environments, and offers a hybrid deployment strategy to meet diverse organizational needs. It enables users to visually explore data and share insights through compelling narratives, simplifying complex data relationships into clear and understandable formats. The platform is accessible to a wide range of users, thanks to a code-free, drag-and-drop interface that requires no specialized skills for creating interactive data visualizations. It unifies data from various sources, ensuring a consistent and comprehensive view across the organization. With over 35 native data connection options, including JDBC, Oracle Analytics Cloud empowers users to access and manage data securely, whether individually, in teams, or across the entire enterprise.
What does Oracle Analytics Cloud do?
Oracle Analytics Cloud serves as a dynamic BI tool that accelerates the data analytics process, enabling decision-makers to act on actionable information. It democratizes the use of machine learning, allowing business users without technical expertise to leverage these advanced technologies. Data scientists and developers can also benefit from the high-performance computing capabilities of the Oracle Autonomous Database environment, which supports various programming languages such as Python, R, and SQL. For organizations already using Oracle Business Intelligence, the platform offers a seamless transition with the bring your own license model. Oracle Analytics Cloud is designed to cater to a wide array of data analytics needs, from creating data connections to sharing insights, all within a secure and governed framework.
Oracle Analytics Cloud Key Features
Flexible Deployment Options: Oracle Analytics Cloud supports a hybrid approach, allowing organizations to choose between on-premises and cloud-based analytics, providing a flexible path to the cloud.
Embedded Machine Learning: The platform incorporates machine learning directly into the analytics workflow, enabling users to easily apply predictive analytics and gain deeper insights from their data.
Natural Language Processing: With natural language processing capabilities, Oracle Analytics Cloud allows users to interact with data in a more intuitive way, making analytics more accessible to a broader audience.
Code-Free Data Visualization: A user-friendly, drag-and-drop interface lets users create interactive data visualizations without the need for specialized technical skills.
Data Unification: Oracle Analytics Cloud offers extensive data connection options, ensuring that data from different sources can be unified for a consistent and complete organizational view.
Security and Governance: The platform is built with a strong emphasis on security and governance, ensuring that data management and analytics processes comply with organizational policies and standards.
Collaboration Tools: Users can collaborate effectively by sharing insights and visual stories, facilitating better communication and decision-making within teams and across the organization.
High-Performance Computing: Leveraging the Oracle Autonomous Database, the platform provides a robust computing environment for data scientists and developers to build, train, and publish models efficiently.
4. Spotfire
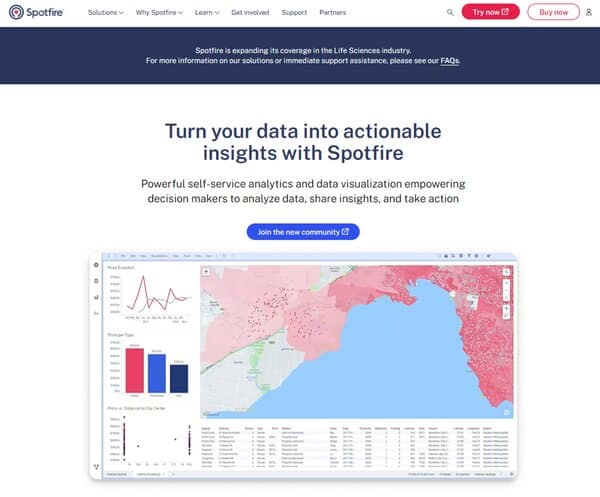
Spotfire is a comprehensive BI tool designed to provide users with the ability to access, analyze, and visualize their data in a dynamic and interactive manner. It caters to a wide range of industries and professionals, including market researchers, sales representatives, scientists, and process engineers, by offering a platform that simplifies the process of identifying trends and patterns in critical business data. Spotfire supports data access from various sources, including desktops, network file systems, and remote databases, facilitating an environment where users can interactively filter data and receive instant answers. Its capabilities extend to creating sleek visualizations and dynamic reports, enhancing the ability to respond to business events rapidly and share insights across teams and with customers.
What does Spotfire do?
Spotfire enables users to merge disparate data sources into a single analysis, providing a comprehensive view of the information through interactive visualizations and dashboards. This BI tool empowers users to perform advanced data analysis, including predictive analytics, without the need for extensive IT involvement. Spotfire’s intuitive interface allows for the rapid creation of reports that can be easily turned into presentations, fostering a culture of data-driven decision-making within organizations. It also offers AI-driven analytics, making it simpler to plot interactive data on maps and transform data into actionable insights. By accelerating data analysis across an organization, Spotfire aids in making faster, more confident, and accurate decisions, thereby optimizing business operations and strategy.
Spotfire Key Features
Data Visualization: Spotfire excels in transforming raw data into meaningful insights through a variety of visualization tools such as bar charts, scatter plots, and 3D charts. These tools allow users to interact with their data in real-time, making complex data sets understandable at a glance.
Predictive Analytics: One of Spotfire’s standout features is its predictive analytics capability, which leverages statistical methods and machine learning to forecast future trends based on historical data. This feature enables businesses to anticipate market changes and make informed decisions.
Data Wrangling: Spotfire simplifies the process of cleaning, structuring, and enriching data within the platform. Users can easily manipulate their data to fit their analysis needs without having to resort to external software, streamlining the data preparation process.
Real-Time Collaboration: The platform promotes teamwork through its collaborative features, allowing users to share insights and visualizations securely. This fosters a culture of transparency and collective problem-solving within organizations.
Flexible Data Access: Spotfire’s ability to connect to a wide array of data sources, including cloud-based services and on-premise databases, ensures that users have seamless access to the data they need. This flexibility supports a holistic approach to data analysis and reporting.
Customizable Dashboards: Users can create tailored dashboards that highlight key metrics and insights relevant to their specific business needs. These dashboards are interactive and can be easily shared across the organization, enhancing communication and strategic alignment.
5. IBM Cognos Analytics
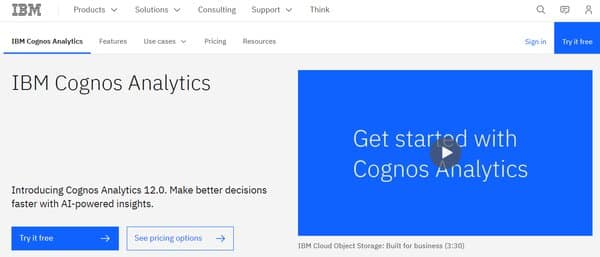
IBM Cognos Analytics is a sophisticated business intelligence software that equips organizations with the necessary tools to harness their data for insightful decision-making. It integrates advanced analytics with artificial intelligence to provide a comprehensive view of business operations, enabling users to predict future trends, understand outcomes, and derive actionable insights. The platform is designed to cater to a wide range of industries, offering capabilities that streamline data exploration, preparation, modeling, and analysis. With its user-friendly interface, IBM Cognos Analytics simplifies complex data tasks, making it accessible for data professionals and business users alike to collaborate and drive performance improvements across their organizations.
What does IBM Cognos Analytics do?
IBM Cognos Analytics serves as a dynamic data analysis and visualization tool that empowers users to transform raw data into meaningful insights. It facilitates the exploration and cleaning of large datasets, automates data preparation with AI assistance, and enables the creation of visually compelling reports and dashboards. The software’s self-service capabilities allow users to perform advanced data operations without the need for extensive technical knowledge. By providing a secure environment for data sharing and collaboration, IBM Cognos Analytics ensures that insights are accessible to all relevant stakeholders, fostering a data-driven culture within organizations. It supports deployment across various environments, including cloud, on-premises, and hybrid setups, ensuring flexibility and scalability to meet the evolving needs of businesses.
IBM Cognos Analytics Key Features
AI-Powered Automation and Insights: IBM Cognos Analytics leverages artificial intelligence to automate data blending and optimization, uncovering hidden trends and providing real-time insights. This feature allows users to delve deeper into their data, revealing the underlying factors driving business outcomes.
Predictive Analytics and Forecasting: The platform includes predictive forecasting and decision trees, enabling users to anticipate future trends and make informed decisions. This forward-looking approach helps businesses stay ahead of the curve by identifying potential opportunities and risks.
Natural Language Processing: With an AI assistant that understands plain language queries, IBM Cognos Analytics simplifies the process of data exploration. Users can ask questions directly and receive visualizations as answers, making data analysis more intuitive and accessible.
Data Visualization and Reporting: Users can create powerful visualizations and multi-page reports to tell the story of their data. The software’s reporting capabilities ensure that insights are presented in a clear and impactful manner, suitable for sharing with various stakeholders.
Governance and Security: IBM Cognos Analytics provides robust governance features, allowing organizations to control access to sensitive data and maintain compliance with industry regulations. This ensures that data is protected from misuse while still being available for analysis.
Flexible Deployment Options: The tool offers the flexibility to be deployed on-premises, in the cloud, or in a multi-cloud environment. This adaptability allows businesses to choose the deployment model that best fits their infrastructure and operational requirements.
Collaboration Tools: Enhancing teamwork, IBM Cognos Analytics integrates with collaboration platforms like Slack and email, enabling team members to share data and insights seamlessly, regardless of their location. This feature promotes a collaborative approach to data-driven decision-making.
Mobile Accessibility: With a new mobile app, IBM Cognos Analytics extends its reach beyond the desktop, allowing users to access data and receive alerts on their smartphones. This ensures that stakeholders can stay informed and always connected to their data.
6. Qlik Sense
Qlik Sense is a modern analytics platform designed to support the full spectrum of business intelligence needs within an organization. This BI tool offers robust data preparation and integration capabilities, enabling users to handle a diverse range of data sources, both large and small. The platform’s self-service catalog ensures that users have access to analytics-ready data, with clear visibility into its origin and journey. This transparency fosters confidence in data utilization, allowing for informed decision-making. Qlik Sense also facilitates the creation of automation workflows and the triggering of event-driven actions, not only within its own environment but across other cloud applications as well. Its visual, low-code interface simplifies the process of connecting to a variety of cloud services. Additionally, the platform encourages collaborative analytics by allowing users to add narrative to their data, create discussion threads, and support team decision-making with essential business context.
What does Qlik Sense do?
Qlik Sense empowers organizations to harness their data for insightful analytics. It streamlines the process of preparing and integrating data, making it easier for users to combine vast amounts of information from different sources. The platform’s governance features ensure that data is trustworthy and analytics-ready, which is crucial for businesses that rely on data accuracy and integrity. Qlik Sense’s automation capabilities enable users to set up workflows that respond to specific events, enhancing efficiency and productivity. The tool’s connectivity with cloud applications through its extensive library of connectors expands its utility, allowing for seamless integration with existing business systems. Moreover, Qlik Sense promotes active engagement with data through interactive discussion threads and contextual narratives, which enriches the analytical experience and supports more nuanced and collective decision-making.
Qlik Sense Key Features
Data Preparation and Integration: Qlik Sense provides a comprehensive suite of tools for preparing and integrating data, which allows users to work with a wide array of data sources effectively.
Self-Service Data Catalog: The platform offers a well-governed catalog that helps users easily find and trust the data they need for analysis, ensuring that the data’s origin and journey are transparent.
Automation Workflows: Users can build and manage automation workflows within Qlik Sense, enabling them to automate tasks and trigger actions based on specific events, which streamlines processes and saves time.
Cloud Connectivity: A broad library of connectors to various cloud applications is available, allowing for easy integration and data flow between Qlik Sense and other tools used within the organization.
Collaborative Analytics: The platform supports collaborative decision-making by allowing users to add context to their analytics, create discussion threads, and interact with others around data, fostering a team-oriented approach to business intelligence.
7. Yellowfin
Yellowfin is a comprehensive Business Intelligence (BI) platform designed to simplify the analytics workflow from start to finish. It offers a suite of tools for connecting to and preparing data, building dashboards, and generating management reports. With a focus on creating actionable dashboards and data visualizations, Yellowfin incorporates a no code/low code development environment, making it accessible for business users to derive insights and make informed decisions. The platform is tailored to accelerate the delivery of data experiences, enabling companies to leverage their data for innovation and competitive advantage efficiently. Yellowfin’s approach to analytics is centered around automation, storytelling, and the creation of visually impactful dashboards, aiming to reduce the time to value for businesses and ensure the reliability and accuracy of data analysis.
What does Yellowfin do?
Yellowfin provides a full spectrum of business intelligence reporting tools that empower organizations to transform their data into actionable insights. It streamlines the entire analytics process, from data connection and preparation to dashboard creation and report generation. By embedding operational workflows within its dashboards, Yellowfin elevates data visualization to new heights, enabling users to not only view but also act on their data within the same environment. This integration of analytics and operations facilitates a more dynamic use of data, supporting businesses in making faster, more informed decisions. Furthermore, Yellowfin is committed to delivering value from data rapidly, with a strong emphasis on customer support and a low administrative footprint, making advanced analytics accessible to a broader range of users without significant investment.
Yellowfin Key Features
Action-Based Dashboards: Yellowfin’s dashboards are designed to be more than just visual representations of data, they are actionable tools that allow business users to interact with their data in meaningful ways. This feature enables users to not only analyze but also act on their insights directly from the dashboard, enhancing the decision-making process.
No Code/Low Code Development Environment: This environment democratizes the use of Yellowfin, making it accessible for users with varying levels of technical expertise. It simplifies the process of creating complex data visualizations and operational workflows, allowing more users to contribute to the analytics process.
Automated Analysis: Yellowfin incorporates automation in key areas of the analytics workflow, such as data preparation and analysis. This reduces the time and effort required to generate insights, ensuring that data is both timely and reliable.
Exceptional Customer Support: Understanding the importance of support in the analytics journey, Yellowfin places a strong emphasis on providing exceptional customer service. This ensures that users can maximize the value of the platform and overcome any challenges swiftly.
Low Cost of Ownership: By delivering analytics capabilities to a wide user base with minimal administrative requirements, Yellowfin ensures that businesses can scale their analytics efforts without incurring significant costs. This makes advanced analytics more accessible and sustainable for organizations of all sizes.
8. Amazon QuickSight
Amazon QuickSight is a cloud-based business intelligence service provided by Amazon Web Services (AWS) that enables organizations of all sizes to visualize and analyze their data with ease and efficiency. Designed to be both powerful and user-friendly, it offers a wide range of features including interactive dashboards, machine learning (ML) insights, and the ability to perform ad-hoc analysis. With its serverless architecture, Amazon QuickSight scales automatically to accommodate tens of thousands of users, eliminating the need for manual scaling or infrastructure management. This BI tool supports a broad spectrum of data sources, including native AWS data repositories, third-party databases, and SaaS applications, making it a versatile choice for businesses looking to leverage their data for informed decision-making.
What does Amazon QuickSight do?
Amazon QuickSight empowers users to create and share interactive dashboards, perform ad-hoc analyses, and extract business insights from their data with minimal effort. It simplifies the process of connecting to various data sources, both cloud-based and on-premises, and allows for the seamless integration of data into visualizations that can be customized and explored. Users can take advantage of machine learning capabilities to uncover hidden trends, perform forecasting, and receive natural language summaries of their data. Additionally, Amazon QuickSight facilitates collaboration among team members by enabling the sharing of insights and visualizations, thereby enhancing the decision-making process across the organization. Its pay-per-session pricing model also makes it a cost-effective solution for businesses seeking to provide their employees with access to BI tools without incurring significant expenses.
Amazon QuickSight Key Features
Data Connectivity: Amazon QuickSight offers extensive data connectivity options, allowing users to easily connect to a wide array of data sources. This includes AWS data services like Amazon Redshift and Amazon S3, third-party databases such as MySQL and PostgreSQL, and various SaaS applications. This flexibility ensures that users can bring together data from different environments for comprehensive analysis.
Interactive Dashboards: The tool provides interactive dashboards that enable users to visualize their data in a dynamic and engaging way. These dashboards are customizable and offer a variety of visualization options, from simple bar charts to complex scatter plots, helping users to uncover insights at a glance.
Machine Learning Insights: With built-in machine learning capabilities, Amazon QuickSight can automatically detect anomalies, forecast future trends, and provide natural language narratives, making it easier for users to understand their data and make informed decisions.
Serverless Architecture: The serverless architecture of Amazon QuickSight means that it automatically scales to accommodate the number of users, without the need for manual intervention. This ensures that dashboards load quickly, even during periods of high demand, and simplifies the management of BI resources.
Security and Compliance: Amazon QuickSight is designed with built-in security features, including role-based access controls, Active Directory integration, and compliance with multiple industry standards. This ensures that data is protected and that the tool meets the regulatory requirements of various industries.
Mobile App Support: The availability of a mobile app for both iOS and Android devices allows users to access their dashboards and insights on the go. This feature ensures that decision-makers can stay informed, no matter where they are.
SPICE Engine: At the heart of Amazon QuickSight is the SPICE (Super-fast, Parallel, In-memory Calculation Engine), which provides fast, interactive analysis. SPICE enables the tool to perform calculations and render visualizations quickly, even with large datasets, enhancing the user experience.
9. Dundas BI
Dundas BI is a comprehensive data analytics platform that offers a wide range of capabilities for businesses seeking to harness the power of their data. It is designed to be highly customizable and fully programmable, making it an ideal solution for embedding into existing applications. The platform provides users with advanced data preparation, interactive dashboards, and reporting tools, enabling them to create polished and custom data analytics solutions. With its focus on flexibility and user empowerment, Dundas BI facilitates the creation of tailored analytics experiences that can seamlessly integrate with a variety of IT infrastructures, making it a great addition to the list of best BI tools.
What does Dundas BI do?
Dundas BI serves as a versatile business intelligence tool that empowers organizations to access, analyze, and visualize their data for informed decision-making. It connects to various data sources, providing real-time insights through interactive dashboards and reports. The platform supports self-service analytics, allowing users to explore data without relying on IT specialists. Dundas BI’s embedded analytics capabilities enable the integration of powerful analytics directly into users’ applications, enhancing the overall user experience and providing a common reference point for data-driven decisions.
Dundas BI Key Features
Self-Service Analytics: Dundas BI places a strong emphasis on self-service capabilities, allowing users to perform data discovery and analysis independently. This feature reduces the dependency on IT and enables faster insights.
Customizable Dashboards: The platform offers highly customizable dashboards that can be tailored to meet the specific needs of any business. Users can drag-and-drop components and use a variety of visualization options to create a unique analytical experience.
Advanced Data Preparation: With Dundas BI, users have access to sophisticated data preparation tools that simplify the process of cleaning, transforming, and integrating data from multiple sources.
Embedded Analytics: One of the standout features of Dundas BI is its embedded analytics functionality, which allows for the seamless integration of BI capabilities into existing applications, providing a cohesive user experience.
Open APIs: The platform’s open APIs facilitate extensive customization and integration with other systems, making it a flexible solution for businesses with complex IT environments.
Mobile Accessibility: Dundas BI is designed with a mobile-first approach, ensuring that users can access their data and analytics on the go, with full support for touch interactions on mobile devices.
Interactive Reporting: The tool provides interactive reporting features that enable users to drill down into their data and gain deeper insights, with the ability to export reports in various formats.
Scalability: Dundas BI is built to scale with the growing data needs of an organization, supporting both small businesses and large enterprises with its robust architecture.
Security: Security is a key consideration for Dundas BI, which offers features like role-based access control, data encryption, and single sign-on to ensure that data remains secure and compliant with industry standards.
10. SAP Analytics Cloud
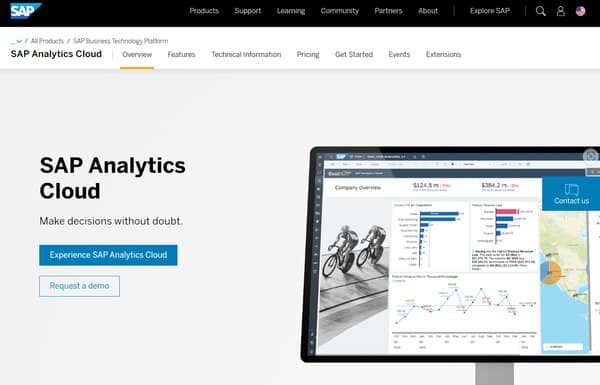
SAP Analytics Cloud is a comprehensive cloud-based solution designed to provide businesses with the tools they need for business intelligence, planning, and predictive analysis. It integrates seamlessly with various data sources, offering a unified platform that supports decision-making processes across all levels of an organization. By leveraging advanced analytics alongside machine learning and artificial intelligence capabilities, it enables users to gain deep insights into their data, fostering an environment where strategic planning and informed decision-making thrive. This platform is tailored to meet the needs of businesses looking for a scalable, secure, and versatile analytics solution that can adapt to the ever-evolving landscape of data analysis.
What does SAP Analytics Cloud do?
SAP Analytics Cloud serves as a multi-faceted platform that brings together business intelligence, planning, and predictive analytics into a single cloud-based environment. It allows users to perform comprehensive data analysis, create interactive reports, and visualize data in a way that is both accessible and meaningful. The platform facilitates real-time insights by connecting directly to various data sources, enabling businesses to stay agile and make timely decisions. With its planning features, organizations can streamline their budgeting and forecasting processes, ensuring alignment with their strategic goals. Additionally, its predictive analytics capabilities empower users to forecast future trends and outcomes, allowing for proactive rather than reactive decision-making. By providing a holistic view of an organization’s data landscape, SAP Analytics Cloud helps businesses to harness the full potential of their data, driving growth and innovation.
SAP Analytics Cloud Key Features
Data Integration and Connectivity: This feature allows SAP Analytics Cloud to connect with both SAP and non-SAP data sources, ensuring that users have access to a wide range of data for comprehensive analysis.
Business Intelligence: It offers robust BI tools that enable users to create dynamic visualizations, dashboards, and reports, making it easier to interpret complex data and share insights across the organization.
Augmented Analytics: Leveraging machine learning and AI, this feature automatically generates insights, suggests actions, and helps in uncovering hidden patterns within the data.
Enterprise Planning: This facilitates collaborative planning processes, integrating financial and operational planning to ensure strategic alignment and improved performance.
Predictive Analytics: Users can forecast future trends and outcomes with predictive analytics, enhancing decision-making with foresight and precision.
Collaboration and Sharing: It promotes teamwork by allowing users to share insights, reports, and dashboards securely, fostering a culture of data-driven decision-making.
Customization and Personalization: SAP Analytics Cloud provides customizable dashboards and reports, enabling users to tailor the platform according to their specific analytical needs and preferences.
Mobile Accessibility: With its mobile app, users can access data and insights on the go, ensuring that decision-makers have the information they need, whenever and wherever they need it.
11. SAS Visual Analytics
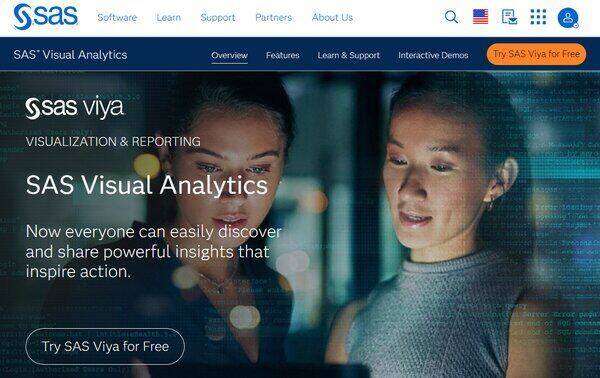
SAS Visual Analytics is an advanced analytics tool designed to facilitate the creation of interactive reports and dashboards, enabling users to glean insights from their data. It combines self-service BI capabilities with advanced analytics, which empowers users of all skill levels to analyze and visualize data. The platform is known for its robust in-memory processing, which accelerates the delivery of complex analytical computations and discoveries. SAS Visual Analytics supports a wide range of data sources and provides a user-friendly interface that simplifies the exploration of data and the communication of findings.
What does SAS Visual Analytics do?
SAS Visual Analytics empowers organizations to transform raw data into operational insights through its comprehensive suite of data visualization and analytics tools. It allows users to explore data interactively, identify trends and patterns, and make data-driven decisions. The software facilitates the creation of visually appealing reports and dashboards that can be shared across an organization, promoting a collaborative approach to data analysis. Additionally, it offers advanced analytics features such as predictive modeling and machine learning, enabling businesses to forecast future trends and optimize their strategies accordingly.
SAS Visual Analytics Key Features
Data Preparation and Quality Functions: SAS Visual Analytics includes tools for data preparation, allowing users to import, cleanse, and transform data from various sources, ensuring high-quality inputs for analysis.
Advanced Analytics and Machine Learning: The platform provides advanced analytics capabilities, including predictive modeling and machine learning algorithms, to uncover deeper insights and forecast future trends.
Interactive Reporting and Dashboards: Users can create dynamic reports and dashboards with interactive elements, enabling a more engaging way to present and explore data.
Self-Service Analytics: It offers self-service analytics that cater to users with varying levels of expertise, from business analysts to data scientists, allowing them to perform complex analyses without the need for extensive training.
Mobile Accessibility: With mobile apps for iOS, Android, and Windows devices, SAS Visual Analytics ensures that insights are accessible on the go, enhancing decision-making processes regardless of location.
Integration with Microsoft Office and SharePoint: The tool integrates seamlessly with Microsoft Office applications, facilitating collaboration and the sharing of insights through familiar platforms.
Scalability and Governance: Designed to scale across an enterprise, SAS Visual Analytics provides robust governance features, ensuring data integrity and security while accommodating the needs of a growing organization.
Customizable Visualizations: A wide array of visualization options is available, from heatmaps and scatter plots to geographical mapping, allowing users to tailor their data presentation to their specific needs.
Augmented Analytics: The software includes augmented analytics features, which suggest the best-fit visualizations for data sets and automate the discovery of related data insights.
Collaboration Features: Collaboration is made easy with features that allow users to annotate, comment, and share reports, fostering a collaborative environment for data-driven decision-making.
12. Zoho Analytics
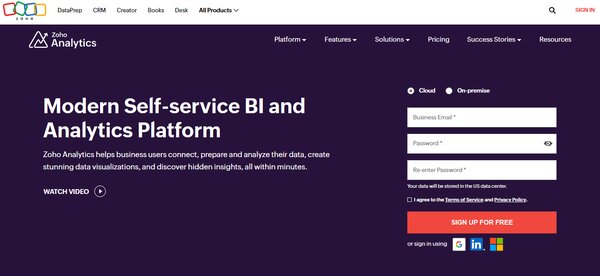
Zoho Analytics is a comprehensive business intelligence (BI) platform designed to bring together a vast array of data analysis capabilities. It serves as a one-stop solution for organizations looking to harness the power of their data. With the ability to connect to a multitude of sources, including files, feeds, popular business apps, and databases, Zoho Analytics simplifies the process of data consolidation. The platform is equipped with an augmented, self-service data preparation module that allows users to cleanse, transform, enrich, and catalog data for more effective analysis. Leveraging artificial intelligence, Zoho Analytics enhances data analysis through features like predictive analytics and cognitive analysis. The intuitive drag-and-drop interface facilitates the creation of insightful and interactive reports and dashboards, making data visualization accessible to users of varying expertise levels. Additionally, the platform encourages collaboration and data storytelling, enabling users to share insights securely and engage in meaningful discussions around reports.
What does Zoho Analytics do?
Zoho Analytics provides a suite of tools that enable businesses to analyze their data comprehensively. It allows users to connect with various data sources and blend that data for a unified view of their business operations. The platform’s AI capabilities facilitate an interactive analytical experience, where users can ask questions and receive automated insights. Zoho Analytics also predicts future trends and sets up smart alerts to keep users informed about significant data changes. The software’s visualization tools help in building reports and dashboards that can be shared and discussed among team members. With the ability to embed BI within custom applications and the flexibility to set up analytics portals branded for the business, Zoho Analytics extends its functionality beyond traditional data analysis, making it a versatile tool for businesses seeking to make data-driven decisions.
Zoho Analytics Key Features
Unified Business Analytics: Zoho Analytics integrates data from various business applications, providing a cohesive view across different functions. This integration allows for comprehensive reporting and insights that span the entirety of an organization’s operations.
Ease of Use: The platform has been recognized for its user-friendly interface, which is reflected in its high scores in the BI Survey 21 report. Users can navigate the platform and perform complex data analysis tasks without needing extensive technical knowledge.
AI-Augmented Analysis: Zoho Analytics enhances the analytical process with AI, enabling users to engage in conversations with a smart assistant, generate automated insights, and perform advanced predictive and cognitive analyses.
Data Visualization: With a wide array of charts, widgets, pivot tables, and tabular views, Zoho Analytics empowers users to create visually compelling reports and dashboards that can be easily interpreted and shared.
Collaboration and Storytelling: The platform promotes collaboration through secured sharing, fine-grained permissions, and the ability to hold discussions around reports. It also supports storytelling with data, allowing users to present their insights in a narrative format.
Embedded BI: Zoho Analytics offers a low-code, no-code approach to embedding analytics into custom applications, enabling businesses to create a seamless data experience within their existing software ecosystem.
Customization and Extensibility: The platform is highly extensible and customizable, allowing businesses to tailor the analytics experience to their specific needs and integrate it deeply with their operational workflows.
13. Tableau
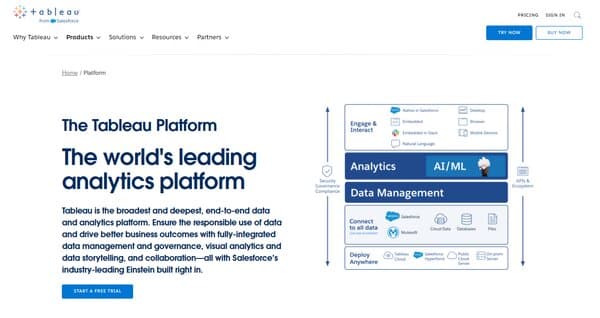
Tableau is a sophisticated data visualization tool that caters to a variety of professional needs, from data analysts and scientists to statisticians and business intelligence professionals. It is designed to transform raw data into intuitive and interactive visualizations, dashboards, and reports, facilitating a deeper understanding and insight into the underlying data. Tableau’s ability to handle vast datasets and connect to numerous data sources makes it a versatile platform for organizations seeking to harness the power of their data for informed decision-making.
What does Tableau do?
Tableau serves as a dynamic platform that simplifies the process of data analysis and visualization. It enables users to create a wide array of visual representations of data, including charts, graphs, and maps, without the need for extensive technical skills or programming knowledge. The tool’s drag-and-drop interface allows for the seamless transformation of complex datasets into actionable insights, making it accessible to users of varying expertise levels. Tableau’s real-time data analysis capabilities ensure that users can make timely, data-driven decisions, while its collaborative features support sharing and teamwork across an organization.
Tableau Key Features
Intuitive User Interface: Tableau’s user-friendly interface is designed to accommodate users with varying levels of technical expertise. It allows for the creation of complex data visualizations through a simple drag-and-drop mechanism, making data analysis more accessible to a broader audience.
Robust Data Connectivity: Tableau offers extensive connectivity options, allowing users to link to a wide range of data sources, including cloud databases, spreadsheets, and big data platforms. This flexibility ensures that users can leverage data from multiple repositories for comprehensive analysis.
Real-Time Data Analysis: With Tableau, users can perform real-time data analysis, which is crucial for making timely decisions. The platform’s ability to handle live data feeds enables organizations to stay up-to-date with the latest information and trends.
Collaborative Environment: Tableau fosters a collaborative environment by providing features that support sharing and teamwork. Users can share dashboards and insights within their organization, promoting a data-driven culture and collective decision-making.
Advanced Analytics: The platform is equipped with advanced analytics capabilities, including predictive modeling and statistical analysis. These features allow users to delve deeper into their data and uncover patterns and trends that might not be immediately apparent.
Mobile Accessibility: Tableau’s mobile application extends the platform’s functionality to iOS and Android devices, providing users with the convenience of accessing and interacting with their data visualizations on the go.
Security: Recognizing the importance of data security, Tableau includes features that help safeguard sensitive information, such as row-level security and user authentication protocols, ensuring that data remains protected.
Community and Support: Tableau boasts a vibrant community of users and experts who share knowledge, tips, and best practices. The platform’s support infrastructure provides users with the resources they need to resolve issues and maximize the tool’s potential.
14. Domo

Domo is a modern BI platform that empowers organizations to harness the power of their data for improved decision-making and strategic business insights. This BI tool offers a suite of tools designed to facilitate the creation of interactive dashboards, comprehensive reporting, and the deployment of AI-generated insights. Domo’s platform is built on a secure and flexible foundation, enabling the integration of real-time data from a multitude of sources. This allows businesses to respond swiftly to changing market conditions and internal dynamics. The platform’s user-centric design ensures that it is accessible to a broad range of users, from technical experts to business professionals, fostering a culture of data-driven decision-making throughout an organization.
What does Domo do?
Domo transforms the way businesses interact with their data by providing a comprehensive suite of tools that streamline the process of data analysis and visualization. It enables users to move beyond simple data representation to create immersive data experiences that drive actionable insights. With Domo, users can build custom data views and reports that cater to the specific needs of their business, allowing for rapid and informed decision-making. The platform’s AI capabilities offer predictive insights, helping to anticipate trends and outcomes. Additionally, Domo’s infrastructure supports data governance and integration, ensuring that data is not only accessible but also managed responsibly within an organization.
Domo Key Features
Intuitive Dashboards: Domo’s dashboards are designed to be user-friendly, allowing users to quickly understand and analyze complex data sets. The dashboards can be customized to display the most relevant information, making it easier for users to focus on the insights that matter most to their role or department.
AI-Generated Insights: The platform leverages artificial intelligence to provide predictive analytics and automated insights. This feature helps users to identify patterns and trends that may not be immediately obvious, enabling proactive decision-making.
Secure Data Integration: Domo offers robust data integration capabilities, allowing businesses to bring together data from various sources into a cohesive and secure environment. This ensures that data is up-to-date and comprehensive, providing a holistic view of the business landscape.
Custom Reporting: Users can create custom reports tailored to their specific needs, which facilitates better understanding and communication of data across the organization. This customization allows for more targeted analysis and supports a wide range of business functions.
Low-Code and Pro-Code App Development: The platform provides tools for both low-code and pro-code app development, making it accessible to users with varying levels of technical expertise. This flexibility enables businesses to quickly build and deploy apps that can automate and enhance their data analysis processes.
Real-Time Data: Domo’s ability to integrate real-time data means that businesses can react to changes as they happen, ensuring that decisions are based on the most current information available.
User-Centric Design: The platform is built with a focus on the user experience, making it easy for anyone within an organization to use, regardless of their technical background. This design philosophy helps to democratize data and encourages a wider adoption of data-driven practices.
Data Governance: Domo provides the infrastructure necessary for effective data governance, ensuring that data is managed in a way that complies with regulations and internal policies, maintaining data integrity and security.
15. Sisense
Sisense is a comprehensive business intelligence tool designed to simplify complex data analysis and make insights accessible to all types of users, from data analysts to business users. It offers a unique approach to BI, combining advanced data analytics and visualization in a single platform. With its user-friendly interface and powerful backend, Sisense enables organizations to seamlessly integrate, analyze, and visualize data from various sources, empowering them to make data-driven decisions quickly and efficiently. Its scalability and flexibility cater to businesses of all sizes, across various industries, making it a versatile tool for anyone looking to leverage their data for strategic advantage.
What does Sisense do?
Sisense transforms the way businesses interact with their data by providing a platform that can handle the entire data analysis process from start to finish. It allows users to connect to multiple data sources, perform complex data analysis using its proprietary In-Chip technology, and create interactive dashboards and reports for data visualization. This end-to-end approach not only simplifies the data analytics process but also accelerates the time to insight, enabling businesses to respond to market changes swiftly. Sisense’s AI-driven analytics further enhance the platform’s capabilities, offering predictive insights and automated data analysis, which can be crucial for strategic planning and operational efficiency. By democratizing data analytics, Sisense empowers every user within an organization to make informed decisions based on real-time data.
Sisense Key Features
Data Integration: Sisense offers robust data integration capabilities, allowing users to consolidate data from disparate sources, including databases, cloud services, and spreadsheets, into a single, coherent view. This feature simplifies the data preparation process, making it easier for users to analyze and visualize their data.
Interactive Dashboards: The platform’s interactive dashboards are designed to provide users with a dynamic way to explore their data. Users can drill down into specifics, filter results, and manipulate data in real-time, offering a deeper understanding of their data without needing technical expertise.
AI and Machine Learning: Sisense incorporates AI and machine learning technologies to provide advanced analytics capabilities, such as predictive analytics and automated insight generation. This feature enables users to uncover trends, forecast outcomes, and make data-driven decisions with greater accuracy.
Embedded Analytics: With Sisense’s embedded analytics feature, businesses can integrate powerful BI capabilities directly into their applications or products. This allows for the delivery of personalized, data-driven experiences to customers, enhancing product value and user engagement.
Customization and Extensibility: Sisense is highly customizable, offering a wide range of options for tailoring dashboards and reports to meet specific business needs. Additionally, its extensible architecture supports the development of custom add-ons and integrations, ensuring that the platform can adapt to evolving business requirements.
16. MicroStrategy

MicroStrategy is a sophisticated BI tool that offers a comprehensive suite of analytics and mobility solutions designed to empower organizations across various industries. By integrating advanced analytics with business intelligence, it enables companies to analyze vast amounts of data and derive actionable insights. MicroStrategy’s platform is built on a foundation of robust security and a semantic graph that enhances data accuracy and governance. Its multi-cloud architecture supports future advancements in AI and machine learning technologies, making it a flexible and scalable solution for businesses looking to leverage data for strategic decision-making.
What does MicroStrategy do?
MicroStrategy provides a powerful analytics and business intelligence platform that allows organizations to access, analyze, and act on business data. It transforms complex data from multiple sources into understandable and actionable insights, facilitating data-driven decision-making across the enterprise. The platform’s capabilities extend to creating detailed reports, dashboards, and mobile apps that deliver personalized analytics to users anywhere, anytime. MicroStrategy’s emphasis on data integrity and security ensures that businesses can trust the insights generated, complying with international data protection regulations such as GDPR and CCPA. By offering a seamless integration with existing systems and a user-friendly interface, MicroStrategy simplifies the analytics process, making it accessible to users of all skill levels.
MicroStrategy Key Features
Semantic Graph: The Semantic Graph underpins MicroStrategy’s approach to data modeling, ensuring transparent and accurate data representation. This feature allows for the reuse of objects and clear data lineage, enabling organizations to maintain control over data accuracy and integrity throughout its lifecycle.
Generative AI Integration: MicroStrategy’s platform integrates generative AI to enhance employee productivity and organizational efficiency. Features like Auto Answers and Auto Dashboard leverage large language models to provide instant, contextually relevant insights and automate dashboard design, respectively.
Multi-Cloud Architecture: The open, multi-cloud architecture of MicroStrategy supports advancements in AI and machine learning technologies. It offers a composable, plug-and-play framework that facilitates ease of integration with various coding and programming languages, meeting the unique needs of different organizations.
Data Privacy and Security: MicroStrategy prioritizes data privacy and security, ensuring compliance with international data protection regulations. The platform is designed to prevent data retention or usage for model training, supporting data confidentiality and integrity.
Mobile Analytics: MicroStrategy extends its BI capabilities to mobile devices, enabling users to access analytics and insights on the go. This feature ensures that decision-makers have immediate access to critical data, regardless of their location, enhancing agility and responsiveness.
Custom AI Bots: With the addition of customizable AI bots like Auto, MicroStrategy allows users to interact with data in natural language, simplifying the process of obtaining business intelligence and making informed decisions without the need for complex dashboards.
17. TIBCO
TIBCO is a renowned provider of infrastructure and business intelligence software, whose solutions are designed to interconnect diverse systems and data sources, and to provide analytical insights that drive real-time decisions. The company’s suite of services encompasses a broad range of functionalities, from data integration and management to complex event processing and innovative analytics. TIBCO’s software is engineered to empower businesses to transform their operations by making data more accessible, understandable, and actionable.
What does TIBCO do?
TIBCO specializes in integrating disparate data and systems, managing APIs, and delivering powerful analytics that enable organizations to harness the full potential of their data. The company’s platform is built to support the rapid development of applications that can adapt to evolving business needs, ensuring that organizations remain agile and responsive. TIBCO’s tools are used across various industries for purposes such as predictive analytics, data visualization, and real-time monitoring, helping businesses to streamline operations, identify new opportunities, and mitigate risks.
TIBCO Key Features
Data Integration and Management: TIBCO provides robust solutions for integrating and managing data across multiple sources, ensuring that businesses have a unified view of their information landscape.
Advanced Analytics: The platform offers advanced analytics capabilities, allowing users to uncover deep insights and forecast trends using sophisticated algorithms and machine learning.
API Management: With TIBCO, organizations can create, deploy, and manage APIs in a secure and scalable environment, facilitating seamless connectivity between applications and services.
Event Processing: The software excels in complex event processing, enabling businesses to analyze and respond to events in real-time, which is crucial for operations like fraud detection and instant decision-making.
Data Visualization: TIBCO’s data visualization tools are designed to make data more accessible and understandable, with interactive dashboards and reports that help convey complex information in a clear and engaging manner.
Cloud Services: Offering a range of cloud services, TIBCO ensures that businesses can leverage the benefits of cloud computing, such as scalability and accessibility, without compromising on functionality or security.
Collaboration Tools: The platform includes collaboration tools that facilitate teamwork and knowledge sharing, making it easier for organizations to make collective, data-driven decisions.
FAQs on BI Tools
What is a BI Tool?
A Business Intelligence (BI) tool is a software application designed to analyze, process, and visualize vast amounts of data from various sources to help organizations make informed decisions. These tools enable users to extract meaningful insights from raw data by providing a comprehensive platform for data analysis, reporting, and dashboarding. BI tools facilitate the transformation of data into actionable intelligence, supporting strategic and operational decision-making processes within an organization.
How do BI Tools Work?
BI tools work by collecting data from internal and external sources, including databases, spreadsheets, and cloud-based applications. This data is then processed and cleaned to ensure accuracy and consistency. Once the data is prepared, BI tools use various analytical processes, such as data mining, statistical analysis, and predictive modeling, to uncover patterns, trends, and correlations. The insights generated are presented through interactive dashboards, reports, and visualizations, making it easier for users to understand and act upon the information.
What are the Key Features of BI Tools?
The key features of BI tools include data visualization, which allows users to create graphical representations of data, dashboarding, providing a centralized view of key performance indicators (KPIs) and metrics, reporting, enabling the generation of detailed and customized reports, data integration, facilitating the consolidation of data from multiple sources, and advanced analytics, offering capabilities like predictive analytics and machine learning to forecast future trends. These features empower organizations to derive meaningful insights from their data, enhancing decision-making processes.
Who Uses BI Tools?
BI tools are used by a wide range of professionals across various industries, including business analysts, data scientists, IT professionals, and executive leaders. Marketing teams use BI tools to track campaign performance and customer behavior, while finance departments rely on them for budgeting and financial forecasting. Operations teams utilize BI tools to optimize processes and supply chain management. Essentially, any department within an organization that requires data-driven insights for decision-making can benefit from BI tools.
What are the Benefits of Using BI Tools?
The benefits of using BI tools include improved decision-making capabilities, as organizations can access real-time data and insights, enhanced efficiency and productivity, due to automated data analysis processes, better data quality and accuracy, as BI tools consolidate and clean data from various sources, competitive advantage, through the identification of trends and opportunities before they become apparent to competitors, and increased customer satisfaction, by understanding and anticipating customer needs and preferences. BI tools also support the development of a data-driven culture within organizations, promoting informed decision-making at all levels.
Conclusion
Implementing Business Intelligence tools within an organization unlocks a treasure trove of data-driven insights, significantly enhancing decision-making processes across all levels. By leveraging the power of BI tools, businesses can transform raw data into actionable intelligence, leading to improved operational efficiency, increased competitiveness, and a deeper understanding of market dynamics and customer preferences. The ability to access real-time insights and predictive analytics empowers organizations to anticipate changes and adapt strategies accordingly, ensuring sustained growth and success in today’s data-centric world. As organizations continue to recognize the value of data-driven decision-making, the adoption of BI tools is set to rise, marking a pivotal shift towards more informed, agile, and strategic business practices.