9 Best AI Data Analysis Tools
Wouldn’t it be fantastic if you could automate the tedious task of data analysis, freeing up your time to focus on strategic decision-making? Welcome to the world of AI Data Analysis Tools. These tools are revolutionizing the way we handle and interpret data, providing insights that were previously unattainable.
In this article, we will delve into the world of AI Data Analysis Tools, exploring their features, benefits, and how they are transforming the landscape of data analysis. We will also address some of the most frequently asked questions about these tools, providing you with a comprehensive understanding of this exciting technology.
The Importance of AI Data Analysis Tools
AI Data Analysis Tools are software programs that leverage artificial intelligence and machine learning algorithms to analyze large volumes of data and extract meaningful insights. These tools can handle tasks such as predictive modeling, segmentation analysis, data cleaning and preparation, natural language processing, visualization and reporting, anomaly detection, and clustering.
The power of AI Data Analysis Tools lies in their ability to automate repetitive data analysis tasks, allowing data professionals to focus on strategic decision-making. They can sift through massive amounts of data, identifying patterns, anomalies, and trends that might go unnoticed by human analysts. Moreover, these tools bring a level of consistency and accuracy that’s hard to achieve manually. By continuously learning from new data, they refine their analysis methods, ensuring up-to-date insights.

Best AI Data Analysis Tools
How to choose the best AI Data Analysis Tools?
When choosing the best AI Data Analysis Tools, several parameters should be considered:
Type of AI Used: AI encompasses many techniques, including rules-based logic, machine learning, and deep learning. Depending on the task, one technique or a combination of techniques might be needed.
Data Source: AI is only as good as its data. It’s important to understand what data is feeding the AI tool you are considering.
Model Performance: Understanding how models perform can be crucial in deciding if they are right for the problem you are trying to solve.
Ground Truth of the AI Tool: It’s crucial to seek tools that have been trained on ground truth data that most closely approaches the ideal standard for decision-making quality.
Usability and Performance: The tool should be user-friendly and reliable, with stable performance.
Bias: Users of AI-powered tools should be aware of potential biases in the results.
Best AI Data Analysis Tools (Free and Paid)
1. Julius AI
Julius AI is an AI data analysis tool specializes in interpreting, analyzing, and visualizing structured data, making data analysis accessible even for those without a background in data science or statistics. Julius AI can handle a variety of structured data sources, including spreadsheets, SQL databases, and CSV files. The beauty of Julius AI lies in its simplicity. You interact with the tool through chat prompts, asking questions, or giving commands. Julius AI then performs the analysis and presents the results in an easy-to-understand format. This not only saves you time but also makes data analysis an attainable goal, regardless of your expertise level.
Julius AI Key Features
- Specializes in interpreting, analyzing, and visualizing structured data.
- Makes data analysis accessible for individuals without a background in data science.
- Can handle various forms of structured data, including spreadsheets, SQL databases, and CSV files.
- Allows interaction through chat prompts, making it user-friendly.
- Provides auto-cleaning, auto-analysis, and guided charting supported by AI.
- Offers a Text-to-Chart interface for easy visualization of data.
- Can generate machine learning models for predictive analysis.
- Allows monitoring of Key Performance Indicators (KPIs) in real time.
- Capable of identifying trends and anomalies in data.
- Can generate new columns using AI for sentiment analysis, summarizing text, and generating content.
Julius AI Pros and Cons
Pros:
- User-friendly interface that allows interaction through chat prompts.
- Makes data analysis accessible for individuals without a background in data science.
- Can handle various forms of structured data, including spreadsheets, SQL databases, and CSV files.
- Provides auto-cleaning, auto-analysis, and guided charting supported by AI.
- Offers a Text-to-Chart interface for easy visualization of data.
Cons:
- The free plan has limited capabilities.
- Some users have reported issues with the database not showing useful results for certain regions.
- Requires a code sent to the user’s cell phone every time they try to log in, which some users find inconvenient.
Julius AI Pricing Plans
Julius AI offers 4 pricing plans:
Free Plan: This plan allows users to send up to 15 messages every month. It is designed to let users try and test the platform before purchasing a paid version.
Basic Plan: Priced at $17.99 per month or $149.99 per year (which equals $12.49 per month when billed annually), the Basic Plan allows users to send up to 250 messages per month.
Essential Plan: The Essential Plan offers more features and capabilities, including a higher message limit and additional data analysis tools. You need to contact the sales team to get the pricing.
Pro Plan: The Pro Plan is the most comprehensive package, offering the highest message limit and access to all features and tools. Like the Essential Plan, you need to contact Julius AI sales team to get the pricing.
Julius AI accepts credit cards, PayPal, and bank wire transfer payments.
2. MonkeyLearn
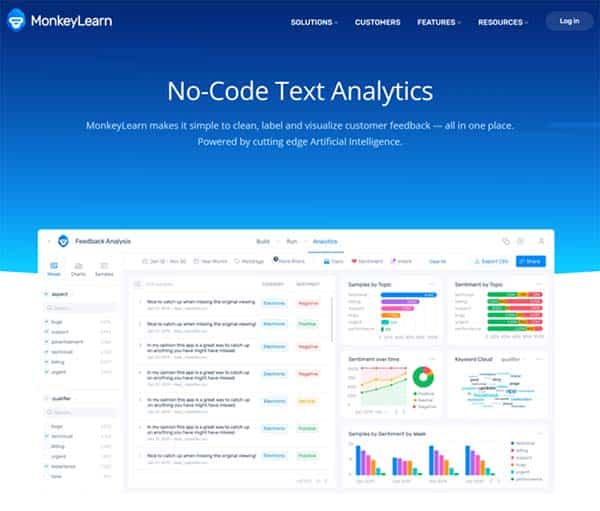
MonkeyLearn is a powerful AI-driven data and text analysis tool designed to help businesses extract valuable insights from unstructured text data. By leveraging machine learning algorithms, MonkeyLearn enables users to automate workflows, analyze sentiment, classify topics, and extract keywords from various sources such as emails, chats, social media comments, and online reviews.
MonkeyLearn Key Features
- User-friendly interface for creating and training custom machine learning models.
- Pre-trained models for common text analysis tasks like sentiment analysis and topic detection.
- Seamless integration with popular tools like Zendesk, Google Sheets, and Zapier.
- Scalable cloud-based platform capable of handling large volumes of data.
- Comprehensive API for easy integration into existing applications.
- Real-time insights and data visualization through MonkeyLearn Studio.
- No-code solution for building and deploying machine learning models.
- Extensive documentation and tutorials for users of all skill levels.
MonkeyLearn Pros and Cons
Pros:
- Easy-to-use platform for both beginners and experts in machine learning.
- Wide range of pre-trained models and custom model creation options.
- Integrations with popular tools streamline processes and improve efficiency.
- Scalable solution suitable for handling large amounts of data.
- Strong customer support and extensive documentation.
Cons:
- Pricing may be a concern for smaller businesses or individual users.
- Limited to text analysis tasks, not suitable for other types of data analysis.
- No mobile application available for on-the-go use.
MonkeyLearn Pricing Plans
MonkeyLearn offers three pricing plans:
Team Plan: Priced at $299 per month, the Team plan includes access to the MonkeyLearn API with 10,000 queries per month. This plan is designed for teams that need to perform text analysis tasks on a regular basis and require a robust, scalable solution.
Custom Plan: For businesses with unique requirements or larger volumes of data, MonkeyLearn offers a custom plan. You need to contact the MonkeyLearn sales team directly for a quote.
Academic Plan: For educational purposes, MonkeyLearn provides a free version to help students and educators to leverage the power of AI-driven text analysis.
MonkeyLearn accepts credit cards payments.
3. Tableau
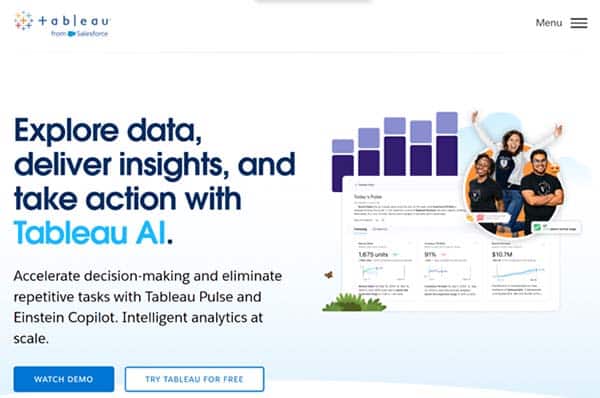
Tableau is a leading AI data analysis tool and business intelligence tool that is widely used for reporting and analyzing vast volumes of data. Owned by Salesforce, Tableau helps users create different charts, graphs, maps, dashboards, and stories for visualizing and analyzing data, to help in making business decisions. It has a lot of unique, exciting features that make it one of the most popular tools in business intelligence.
Tableau AI is a significant innovation in the platform, leveraging the advanced capabilities of generative AI to simplify and democratize the process of data analysis. This next generation of Tableau is built on the trusted and ethical principles of Einstein, ensuring its reliability and safety for everyone that uses it. The significant advantage of Tableau AI is its ability to enhance every part of the Tableau platform to drive performance, efficiency, and scale.
Tableau Key Features
- Tableau AI brings trusted generative AI to the entire Tableau Platform to democratize data analysis.
- Automates data analysis, preparation, and governance, providing users with helpful guidance and contextual instructions within the product.
- Delivers insights in plain language, and even proactively surface the questions the user might ask next.
- Supports numerous data sources and provides connectivity with Live and In-memory Data.
- Offers informative dashboards for better data visualization and analysis.
- Provides convenient options to collaborate with other users and instantly share data in real-time.
- Allows secure sharing of data from various data sources such as on-premise, on-cloud, hybrid, etc.
- Tableau Accelerators are ready-to-use dashboards that you can combine with your data and customize to fit your needs.
- Tableau Exchange is an extensive online marketplace that provides a wide range of accelerators, connectors, and dashboard extensions to enhance your Tableau environment.
- Zoom and pan controls in Tableau are interactive functionalities that let you adjust the view of your data.
Tableau Pros and Cons
Pros:
- High Performance: Users rate Tableau’s overall performance as strong and secure. It can handle millions of rows of data with ease.
- Data visualization: Tableau is a data visualization tool first and foremost, supporting complex computations, data blending, and dashboarding for creating beautiful visualizations.
- Ease of Implementation: Tableau is known for its user-friendly interface and ease of implementation.
- Tableau can handle large amounts of data without compromising on performance or speed.
Cons:
- Tableau’s licensing cost is considered expensive, especially when you have many users compared to other platforms.
- Some users have reported that Tableau lacks flexibility for customization of visualizations.
- Tableau’s usability can be challenging for beginners, and it has a steep learning curve.
- Tableau is strictly a visualization tool and requires preprocessing of data before loading, which may require additional tools.
Tableau Pricing Plans
Tableau offers three main pricing plans:
Tableau Creator: Priced at $75 per user/month, billed annually. This plan includes Tableau Desktop, Tableau Prep Builder, and one Creator license for Tableau Server or Tableau Online.
- Comprehensive suite of products for end-to-end analytics workflow.
- Access to Tableau Desktop and Tableau Prep Builder.
- One Creator license for Tableau Server or Tableau Online.
Tableau Explorer: Priced at $42 per user/month, billed annually. This plan is designed for users who need to explore and analyze data using pre-built dashboards and visualizations.
- Access to pre-built dashboards and visualizations.
- Collaborate with other users and share insights.
- Requires at least one Tableau Creator license in the organization.
Tableau Viewer: Priced at $15 per user/month, billed annually. This plan is for users who only need to view and interact with dashboards and visualizations created by others.
- View and interact with dashboards and visualizations.
- Securely access and share data insights.
- Requires at least one Tableau Creator license and one Tableau Explorer license in the organization.
Tableau accepts various payment methods, including credit cards and PayPal.
4. Akkio
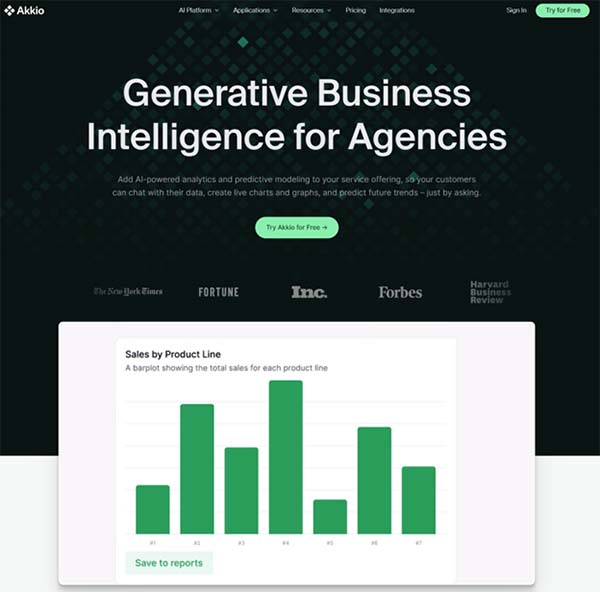
Akkio is a no-code AI data analysis tool designed to empower businesses with predictive modeling capabilities. It’s a tool that allows users to create and deploy machine learning models with just a few clicks, eliminating the need for extensive coding or machine learning expertise. Akkio is designed to be user-friendly, making it accessible to a wide range of users, from business analysts to executives. It’s a versatile tool that can be used across various business operations, from sales and marketing to finance and customer support.
Akkio stands out for its speed, ease of use, and high performance. It’s designed to integrate seamlessly with existing business tools and platforms, allowing users to generate actionable insights and make data-driven decisions in real time. Akkio’s intuitive design and powerful analytics engine make it a formidable tool for businesses aiming to leverage AI for data analysis and decision-making.
Akkio Key Features
- Provides an easy-to-use platform for creating, training, and deploying machine learning models.
- Offers data transformation and visualization tools that translate into a predictive modeling solution.
- Enables users to understand the factors that drive their business performance.
- Allows users to automate and improve workflows through seamless integration with existing tools and platforms.
- Empowers teams with AI, allowing for the creation, sharing, and collaboration on models.
- Supports over a dozen integrations for all important business data.
- Allows sharing of reports and charts with a public URL for easy access to business insights.
- Provides a web app deployment for stakeholders to run predictions themselves.
Akkio Pros and Cons
Pros:
- User-friendly interface that requires no coding or machine learning expertise.
- Fast and efficient, allowing for the creation and deployment of predictive models in minutes.
- Seamless integration with existing business tools and platforms.
- Provides actionable insights that can be used to make data-driven decisions.
- Offers a cost-effective solution with fair pricing.
- Provides excellent customer support.
Cons:
- While Akkio is designed to be user-friendly, there may be a learning curve for users who are new to AI and machine learning.
- The platform’s versatility may be overwhelming for some users, requiring them to spend time exploring and understanding all the features.
- As with any AI tool, the accuracy of predictions depends on the quality of the data inputted into the system.
Akkio Pricing Plans
Akkio offers four pricing plans:
Starter Plan – This plan is ideal for individuals or small businesses just starting with AI-powered analytics and predictive modeling. It costs $49 per month.
Professional Plan – Designed for companies with more data that need powerful predictive capabilities, this plan is priced at $499 per month.
Agency Plan – This plan is suitable for businesses with extensive data needs and costs $1,499 per month.
Enterprise Plan – This is a custom plan tailored to the specific needs of large enterprises. For pricing details, users are advised to contact the Akkio sales team.
Akkio accepts credit card, and PayPal payments.
5. Microsoft Power BI
Microsoft Power BI is a robust suite of business intelligence tools designed to transform raw data into meaningful insights. It is a collection of software services, apps, and connectors that work together to turn unrelated sources of data into coherent, visually immersive, and interactive insights. Power BI allows users to connect to various data sources, visualize what’s important, and share that with anyone or everyone they want. It is a versatile tool that can be used on Windows desktop, as an online Software as a Service (SaaS), and on mobile apps for Windows, iOS, and Android devices.
Power BI is designed to serve different roles effectively. It can be used to create reports for your team about customer engagement statistics, view inventory and manufacturing progress in a real-time dashboard, or create a paginated report of mailable invoices. The tool is flexible and can be used differently based on the user’s role and the specific feature or service of Power BI that best suits their situation.
Microsoft Power BI Key Features
- Offers a range of attractive visualizations to represent data.
- Allows data connection from various sources including Excel spreadsheets, cloud services, and on-premises databases.
- Provides customizable dashboards that update in real-time.
- Enables data filtration for precise analysis.
- Offers frequent updates to improve features and capabilities.
- Allows creation of sharable reports, dashboards, and apps.
- Provides a unified platform for self-service and enterprise analytics.
- Enables data-driven culture across the organization with BI and analytics capabilities.
- Allows users to consolidate data from multiple sources, make interactive dashboards, evaluate data, and create informative reports.
Microsoft Power BI Pros and Cons
Pros:
- Power BI is cost-effective. It is free to use for building reports for personal use and offers cloud or on-premise hosting for a small fee per user for shared reports and data.
- It offers frequent updates, with Microsoft actively listening to the user community for suggestions for improvements.
- Power BI allows users to work with a large amount of data, making it a powerful tool for data analysis.
- It offers customizable dashboards and drill-down analysis, enhancing the user’s ability to understand and interpret data.
- Power BI provides report sharing and collaboration features, making it easier for teams to work together on data analysis.
Cons:
- Power BI has a limit on the amount of data it can ingest. After the data hits the limit, users have to upgrade to the paid version of Power BI.
- Ingesting millions of rows of data can take a long time, which can be frustrating for users working with large amounts of data.
- The free version of Power BI samples data when exporting it in large amounts, which may not be ideal for all users.
Microsoft Power BI Pricing Plans
Microsoft Power BI offers 4 pricing plans:
Power BI in Microsoft Fabric: This plan is free (no credit card is required), offering limited access to all the Pro plans features.
Power BI Pro: This plan costs $9.99 per user per month. It includes modern, self-service analytics for publishing reports and dashboards and viewing content across your organization. Power BI Pro is also included in Microsoft 365 E5.
Power BI Premium Per User: This plan costs $20 per user per month. It includes all the features available in Power BI Pro, and it is designed for users who require more advanced features and greater capacity.
Power BI Premium Per Capacity: This plan starts at $4,995 per month. It is designed for organizations and uses the same computer capacity and storage. It includes all the features available in Power BI Premium per user. However, this version requires a Power BI Pro license to publish content into Power BI Premium capacity.
Microsoft accepts payments through credit cards for these plans.
6. Polymer
Polymer is an AI data analysis tool that transforms your data into a streamlined, flexible, and powerful database. It’s designed to make data analysis accessible and actionable, even for those who aren’t data scientists or statisticians. With Polymer, you can skip the long and expensive process of developing algorithms and jump right into analyzing your data. This advanced tool uses AI to analyze data and improve users’ understanding of it, all without a long onboarding process. All you need to do is upload your spreadsheet to Polymer and it instantly transforms it into a streamlined database that’s easy to explore for insights.
Polymer offers intuitive visualization capabilities and almost limitless ways of interacting with your data. It’s the simplest way of using AI to analyze your data, offering you a powerful and improved pivot table, and the ability to customize the web app with multiple layouts at any time. Polymer is used by a wide range of professionals, including data analysts, digital marketers, content creators, and more.
Polymer Key Features
- Transforms spreadsheets into a streamlined, flexible, and powerful database.
- Uses AI to analyze data and improve users’ understanding of it.
- Offers intuitive visualization capabilities and almost limitless ways of interacting with your data.
- Allows customization of the web app with multiple layouts at any time.
- Provides a powerful and improved pivot table.
- Makes data exploration easier by automatically generating charts, tables, and maps from your data set.
- Makes your spreadsheets searchable, intelligent, and interactive instantly.
- No need for a long onboarding process or training videos.
- Used by a wide range of professionals, including data analysts, digital marketers, content creators, and more.
Polymer Pros and Cons
Pros:
- User-friendly: Polymer is designed to be accessible and actionable, even for those who aren’t data scientists or statisticians.
- Powerful AI: Polymer uses AI to analyze data and improve users’ understanding of it.
- Customizable: Allows customization of the web app with multiple layouts at any time.
- Visualization capabilities: Offers intuitive visualization capabilities and almost limitless ways of interacting with your data.
- No long onboarding process: All you need to do is upload your spreadsheet to Polymer and it instantly transforms it into a streamlined database.
Cons:
- The platform isn’t available for open-source and is only available through their paid plans.
- Polymer is primarily designed for spreadsheet data, which may limit its use for other types of data.
- Unlike some other tools, Polymer does not offer a free plan, which may be a barrier for some users.
Polymer Pricing Plans
Polymer offers 3 pricing plans:
Starter Plan – The Starter plan is designed for individuals just getting started with Polymer. It costs $20 per editor per month if billed monthly, or $10 per editor per month if billed yearly. This plan includes manual syncing, unlimited connectors, unlimited visualizations, and unlimited templates.
Pro Plan – The Pro plan is suitable for those who want to explore, visualize, and share their data. It costs $40 per editor per month if billed monthly, or $20 per editor per month if billed yearly. In addition to the features of the Starter plan, the Pro plan includes hourly syncing, custom branding, custom metrics & calculations, and unlimited embeds.
Enterprise Plan – The Enterprise plan is designed for companies and teams with custom data needs. It starts at $500 per month. This plan includes real-time syncing, customizable embeds, API access, and dedicated support. It also includes all the features of the Pro and Starter plans.
Polymer accepts all major credit cards for payment.
7. Sisense
Sisense is a business intelligence (BI) and AI data analysis platform that empowers organizations to gather, analyze, and visualize data from a multitude of sources. It is designed to facilitate informed decision-making by providing a user-friendly interface for data exploration and reporting. Sisense simplifies complex data, transforming it into powerful analytic apps that can be shared or embedded anywhere. The platform is designed to leverage all your data, analyze it, and visualize it to impact business decisions and drive change.
Sisense is used by a wide range of industries and organizations to analyze data, gain insights, and drive data-driven decision-making. The platform aims to democratize data by providing tools that are accessible to both technical and non-technical users, making it easier for teams to collaborate and make data-driven decisions.
Sisense Key Features
- Sisense can connect to a wide range of data sources, including databases, spreadsheets, cloud services, and web applications.
- The platform offers a range of visualization options, including charts, graphs, and interactive dashboards.
- Sisense incorporates AI and machine learning capabilities for predictive analytics and data forecasting.
- The platform includes features for data security and governance, ensuring that sensitive data is protected and compliant with relevant regulations.
- Sisense is designed to scale with the needs of the organization, whether it’s a small business or a large enterprise.
- Sisense offers customizable dashboards and formatting capabilities for effective data presentation.
- The platform provides a high-performance backend architecture, capable of handling large amounts of data and multiple tables.
- Sisense offers a unique add-on, Sisense Quest, that enables advanced analytics on any time-series chart.
Sisense Pros and Cons
Pros:
- Sisense offers a very intuitive UI, with a minimal learning curve even for non-technical users.
- The platform provides a solid backend architecture, making it a high-performance platform.
- Sisense offers high performance with huge amounts of data and multiple tables, scalability for thousands of users.
- The platform is very simple to create and publish advanced data visualizations.
- Sisense offers a comprehensive tool to analyze and visualize large, disparate data sets without IT resources.
Cons:
- There could be a simpler way for admins to share dashboards created by multiple users.
- The navigation and filtering on the platform could be improved for better user experience.
- Some users have reported that the model view can be cluttered and hard to visualize relationships.
- Sisense lacks a strong community compared to other platforms, which could limit access to tutorials, articles, videos, and discussions.
- The platform is heavily dependent on web development skills, which could be a barrier for some users.
Sisense Pricing Plans
Sisense offers a flexible and scalable pricing model that is designed to meet the needs of both small companies and large organizations. The pricing is based on the scale of operations and the size of the company and thus you need to contact the sales team to get a custom plan.
8. Qlik
Qlik is an AI data analysis tool that sets the benchmark for a new generation of analytics. It is designed to empower users of all skill levels to interact with and learn from data, providing AI-assisted insights and predictions that inform intelligent action. Qlik’s unique associative analytics engine allows users to explore data freely, making selections in any direction to refine context and make discoveries. This engine delivers instant calculations at the speed of thought, taking users beyond the limits of query-based analytics and dashboards.
Qlik enabling a dynamic relationship with information that reflects the current moment. It combines a real-time data pipeline with action-oriented capabilities that provide in-the-moment insights and drive immediate actions. Qlik is committed to giving users full control of their data and analytics, supporting any combination of public cloud, private cloud, and on-premises sites. It provides a complete set of data preparation and integration capabilities, allowing users to work with nearly limitless combinations of data, both big and small.
Qlik Key Features
- Unique associative analytics engine for exploring data and uncovering insights.
- AI-assisted insights and predictions for informed decision-making.
- Real-time data pipeline for in-the-moment insights and immediate actions.
- Supports any combination of public cloud, private cloud, and on-premises sites.
- Complete set of data preparation and integration capabilities.
- Augmented graphics and discovery features for improved data literacy.
- Convenient, centralized hub for collaboration and information sharing.
- Compatible with a wide range of devices, including desktops, laptops, tablets, and smartphones.
- Advanced analytics accessible to users without a data science background.
- Ability to create, share, and distribute interactive dashboards efficiently.
Qlik Pros and Cons
Pros:
- Powerful associative analytics engine for deep data exploration.
- AI-assisted insights and predictions enhance decision-making.
- Real-time data pipeline enables immediate actions based on current insights.
- Wide compatibility with various devices and platforms.
- User-friendly interface, making advanced analytics accessible to non-data scientists.
Cons:
- As an in-memory tool, it may slow down as data volume increases, requiring higher configuration machines to support large data volumes.
- Some users may find that Qlik requires some technical knowledge to fully understand and utilize its features.
- While it is suitable for simple analytics, setting up custom scenarios and advanced statistical analysis can be challenging.
Qlik Pricing Plans
Qlik offers 3 pricing plans:
Standard Plan: Priced at $20 per user per month with a 10 user minimum, billed annually. This plan includes core analytics capabilities, data connectors, and data preparation features.
Premium Plan: Priced at $2,700 per month, billed annually. This plan offers all the features of the Standard plan, along with advanced analytics, predictive analytics, machine learning, and automation capabilities.
Enterprise Plan: For this plan, you need to contact the sales team for a quote. The Enterprise plan is tailored to larger organizations and includes all the features of the Premium plan, along with additional customization and scalability options.
Qlik accepts credit cards, and bank wire transfer for payments.
9. SAP BusinessObjects
SAP BusinessObjects is a comprehensive business intelligence suite that provides a centralized platform for AI data analysis and reporting, visualization, and sharing. As the on-premises Business Intelligence layer for SAP’s Business Technology Platform, it transforms data into useful insights, available anytime, anywhere.
SAP BusinessObjects is designed to empower business users with self-service access to relevant information, helping them make better decisions and boost overall productivity. The suite offers a flexible architecture that can support growth, accommodating various user numbers and multiple tools and interfaces.
SAP BusinessObjects Key Features
- Empowers users with ad hoc queries and BI reporting for understanding trends and root causes.
- Enables the creation of impactful visualizations, dashboards, and applications for risk assessment, efficiency improvement, and opportunity identification.
- Offers multidimensional data analysis capabilities for filtering and manipulating data, as well as identifying trends and outliers.
- Provides a scalable architecture that supports growth from a few users to tens of thousands, and from a single tool to multiple tools and interfaces.
- Integrates with Microsoft Office for seamless data analysis and collaboration.
SAP BusinessObjects Pros and Cons
Pros:
- Provides a comprehensive suite of BI tools for reporting, analysis, and data visualization.
- Offers self-service capabilities, allowing business users to access and analyze data without heavy IT involvement.
- Supports a wide range of data sources, including SAP HANA and SAP BW.
- Scalable architecture accommodates growth in user numbers and tool usage.
Cons:
- Can be expensive in terms of licensing and overall pricing.
- Integration between acquired products may not always be smooth, leading to potential performance issues.
- Primarily designed for large enterprises, which may not be suitable for smaller businesses.
SAP BusinessObjects Pricing Plans
SAP BusinessObjects offers custom plans and requires that you contact the sales team for pricing.
FAQs on AI Data Analysis Tools
What is an AI Data Analysis Tool?
AI Data Analysis Tools are software programs that use artificial intelligence and machine learning algorithms to analyze large volumes of data and extract meaningful insights.
How do AI Data Analysis Tools work?
AI Data Analysis Tools work by automating the data analysis process. They start with data collection, where data is gathered from various sources. Then, the data is cleaned and organized for analysis. AI algorithms are then used to analyze the data and extract insights. These insights are then interpreted and used to inform decision making.
Who can benefit from using AI Data Analysis Tools?
Anyone who deals with large amounts of data can benefit from using AI Data Analysis Tools. This includes data analysts, data scientists, business analysts, marketing professionals, and decision-makers in various industries.
What are the different types of AI Data Analysis Tools?
There are many types of AI Data Analysis Tools, including predictive modeling tools, segmentation analysis tools, data cleaning and preparation tools, natural language processing tools, visualization and reporting tools, anomaly detection tools, and clustering tools.
Are there free AI Data Analysis Tools available?
Yes, there are free AI Data Analysis Tools available. These include Python libraries like Scikit-learn and TensorFlow, and plugins for Excel data analysis, such as Power Query and Power Pivot.
What are the limitations of AI Data Analysis Tools?
While AI Data Analysis Tools offer numerous benefits, they also have limitations. These include the inability to fully understand the context, potential biases in the results, and the need for large data sets for training. Moreover, they cannot replace the human touch in data analysis, especially when it comes to interpreting and understanding the implications of the insights derived.
Conclusion
AI Data Analysis Tools are transforming the way we handle and interpret data. They offer a powerful solution for automating repetitive tasks, identifying patterns and trends, and extracting meaningful insights from large volumes of data. However, like any technology, they come with their own set of limitations and should be used as a complement to, not a replacement for, human analysis.
As we venture further into the digital age, the symbiotic relationship between AI and data analysis will only deepen. The future of data analysis lies in harnessing the power of AI to make our data work for us, providing us with the insights we need to make informed decisions.
Share your insights and thoughts with other readers.