ECOMMERCE
Complete List of Cart Abandonment Statistics: 2006-2020
In 2020, e-Commerce stores continue to battle cart abandonment. Cart abandonment is when a customer leaves without buying, after adding an item to their cart.
The truth is… as an e-Commerce store you lose sales from cart abandonment.
The questions are
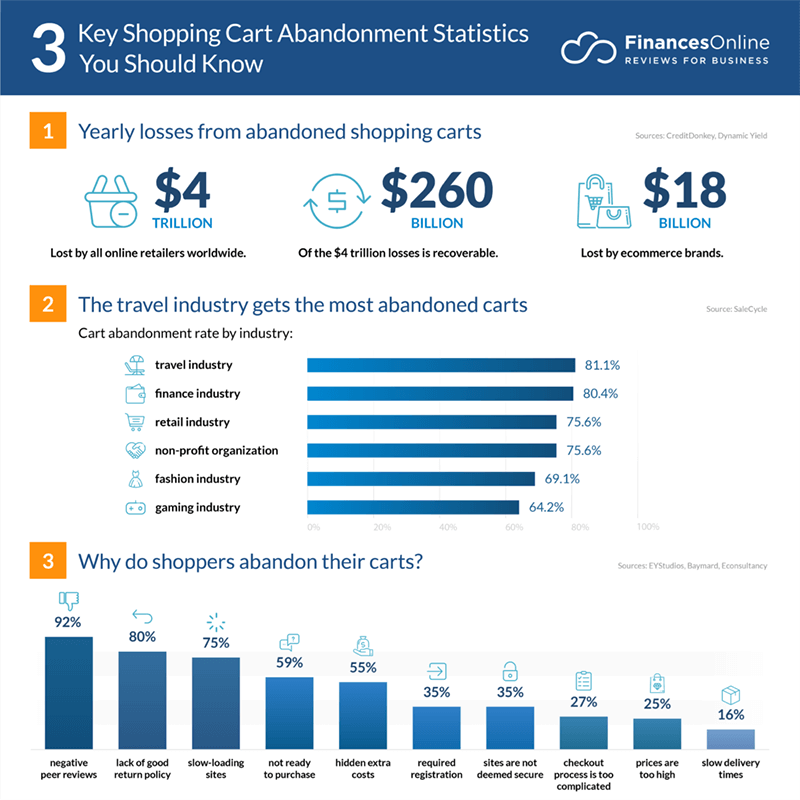
(a) Why customers leave your site without purchasing, and
(b) What you can do about it.
Average Cart Abandonment Rate 2020 Update
There have been hundreds of studies surrounding cart abandonment statistics.
Some studies place abandonment as high as 80%, while other studies place cart abandonment as low as 55%.
In our study, we found the average cart abandonment rate for 2016 was
77.24%. This number rose slightly in 2017 to 78.65%.
In other words, over 3/4 of shoppers choose to leave the site without completing a purchase.
However – as we show below – there is much more to the story of cart abandonment than the average. We segment these aggregate stat across three primary dimensions:
Over Time – How is cart abandonment changing over time?
Across Countries – How does customer cart abandonment change between regions?
Across Device – How does customer cart abandonment change between mobile and desktop?
Cart Recovery – How effective are current cart recovery campaigns
In fact, even the calendar can change cart abandonment rate.
In 2019, Black Friday saw global cart abandonment rates of 73.78%. Just a few days later on Cyber Monday, cart abandonment rate dropped to 68.94%.
The good news is that you have a massive opportunity to dramatically increase revenue by transforming these abandoned carts into recovered ones.
Read more here.
Additional Links:
How To Systematically Reduce Your Cart Abandonment Rate (nudgify)